Improving Ride-Share Earners’ Experience at Large-Scale Events
Role:
Lead UX Researcher
Support Designer
Team:
2 Researchers, 2 Designers,
1 Product Manager
Project Motivation and Background
During large events, riders frequently avoid Uber because coordinating pickups feels chaotic, slow, and unreliable which pushes them towards competitors or alternative modes of transport. This hurts drivers, who face the frustration of navigating surge crowds with little support as well as receive minimal profit. It also serves as detriment to Uber, because peak hours are supposed to be profitable, but their current system is not able to handle it during large scale events.
Uber's goal is straightforward: Make the driver experience more reliable and less frustrating during these moments, so they can capture more trips when it matters most.
Duration:
10 Weeks
In Progress
Stakeholders
Because this is a broad problem space, our focus this quarter was on building a deep understanding of the domain before narrowing scope. That meant mapping the experiences of all key stakeholders involved.
From there, our aim is to identify a specific, actionable area through our research where we can meaningfully move the needle on the driver experience.
Uber
Platform goals and business priorities
Event Organizers
Venue & event logistics and crowd management
Earners
On-the-road experience and pain points
Public Transport + SMEs
How other systems handle large scale events
FIFA Will Bring Lots of Riders, Lets Get Uber Prepared
This matters especially now, with the 2026 FIFA World Cup coming to the United States, one of the largest recurring sporting events in the world, and the scale is hard to overstate.
United States
5.5 Million
Fans projected to attend during 2026
Qatar
3.4 Million
Total Spectators in 2022
With a large influx of fans, many of them unfamiliar with the host cities, this is a prime opportunity for Uber to become the go-to way to get around. And the World Cup is just one large event out of several in the US.
For Uber, this is a significant opportunity in the US. Success would look like drivers completing more trips during large-scale event windows and feeling less frustrated navigating pickups in chaotic conditions.
Russia
3.03 Million
Total Spectators in 2018
Impactful Events in United States
396,144
In the first 90 days of 2026 (By Predict HQ)
As Researchers, We Ask…
During large-scale events, how do earners interact with the current internal GPS and way-finding systems to accurately identify passengers during pickups, and what behavioral and technical challenges influence their motivations?
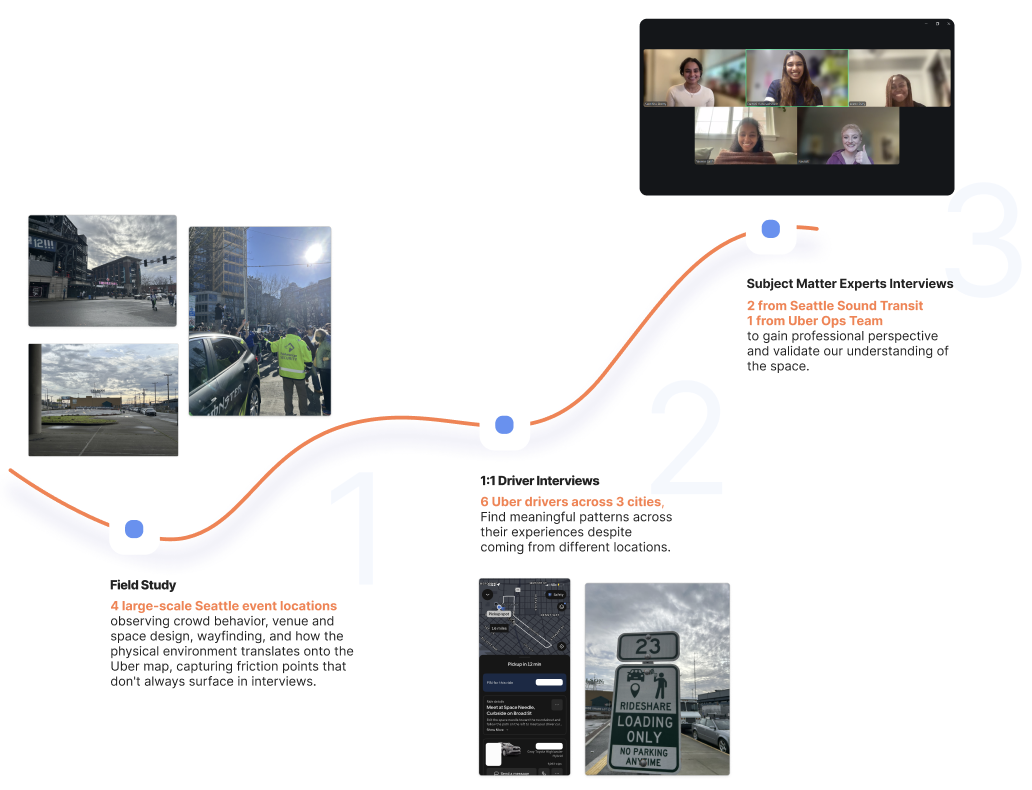
Research Rationale
To build a well-rounded understanding of the space, we structured our research in two stages: secondary research to orient ourselves in the domain, followed by primary research to gather direct, firsthand insight.
01
Digital Ethnography
We analyzed Uber driver app reviews and Reddit communities to understand how drivers are currently experiencing large-scale event pickups and drop-offs in their own words, unfiltered and unprompted.
Zooming In…
02
Competitor Analysis
We conducted a competitor analysis across 7 platforms including Uber, Lyft, Waymo, Lime, Shuttle, Gett, and Curb. Since drivers commonly juggle multiple apps based on availability and earnings, it was important to understand how other platforms are addressing the large-event experience and what solutions are already in place.
Primary Research Methods
03
Literature Review
We also conducted a literature review across 5 key sources to understand how the driver experience during large-scale events is being addressed globally, not just in the US, and to confirm the relevance of the problem.
Synthesizing Findings
What We Can Claim We Know
These are behaviors and pain points confirmed by multiple participants or described in specific, concrete detail.
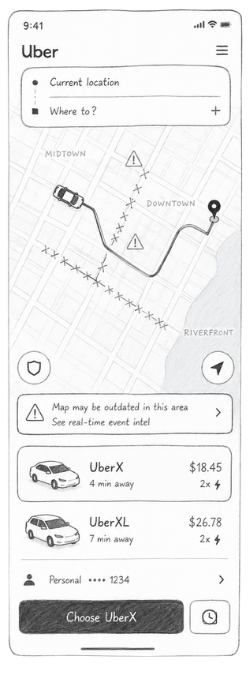
Road closures are not reliably reflected on the Uber map during events
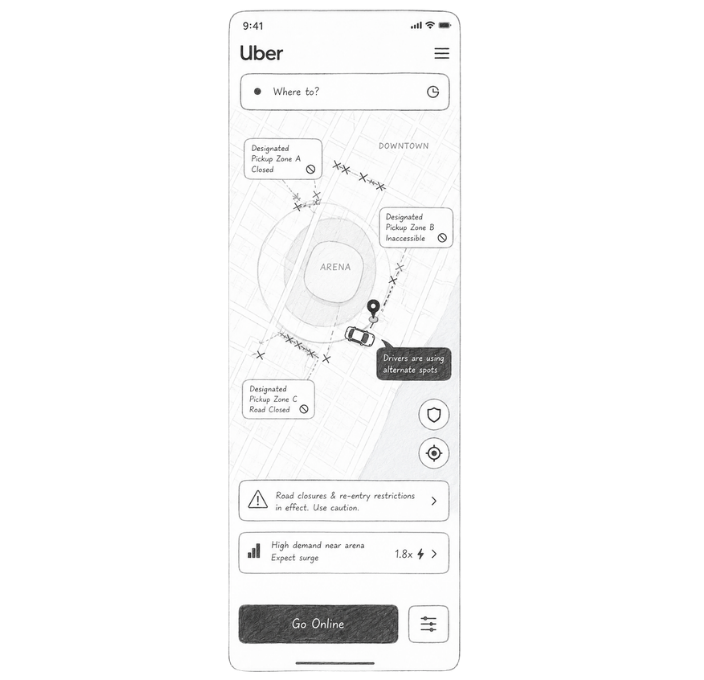
Designated pickup zones are frequently inaccessible or impractical
What Earners Are Saying
P1
Drivers time their arrival to catch the surge rather than arrive early
“Sometimes the Uber app picks it up and sometimes it doesn't. I don't know how well they coordinate with the police shutting down streets — more times than not, they don't.”
P4
“I've got about half a dozen drivers I'm in contact with every day I work — hey, are you working tonight? We share information.”
P5
“Great idea having a designated Uber lot — but once the police are there with all the roads closed trying to get traffic out, you can't get there. I did it once and I'm not going there again.”
Data Debt
Uber drivers form ad-hoc text chains while waiting to share real-time traffic, closures, and hotspots as crowd-sourced control
Drivers rely on personal experience and informal networks for event intelligence, not the app
Passengers don't follow pickup zones, creating coordination friction
P4
“I have different little hidey holes around the city for all the large events. After doing this long enough, I can tell you almost down to 50 feet where the surge bubble is going to show up on my map.”
P1
“I let all the other Uber and Lyft drivers get picked up first. When the surcharges go up — that's when I come in.”
P5
Match Point Stress
Drivers wait 30+ minutes for mismatched short rides across venues: "Not taking 4 minutes after half an hour."
“If you decline too many trips and go below 85%, you lose the benefit of seeing the time and direction. You only see: there's a ride — accept or don't. So you can't just pick and choose all the time.”
Spot Logic
Designated zones are unusable in traffic or poorly located (Lumen Field's back lot: "great idea, poor execution").
Opportunity Matrix
In relations to the potential themes we are aiming to center our design, we have mapped out our 8 overall research insights by implementation effort and driver impact. We determined insights such as In-App Driver Feed--where drivers highly prioritize insider networks within the community would yield high rewards, with fairly high effort in implementing said feature.
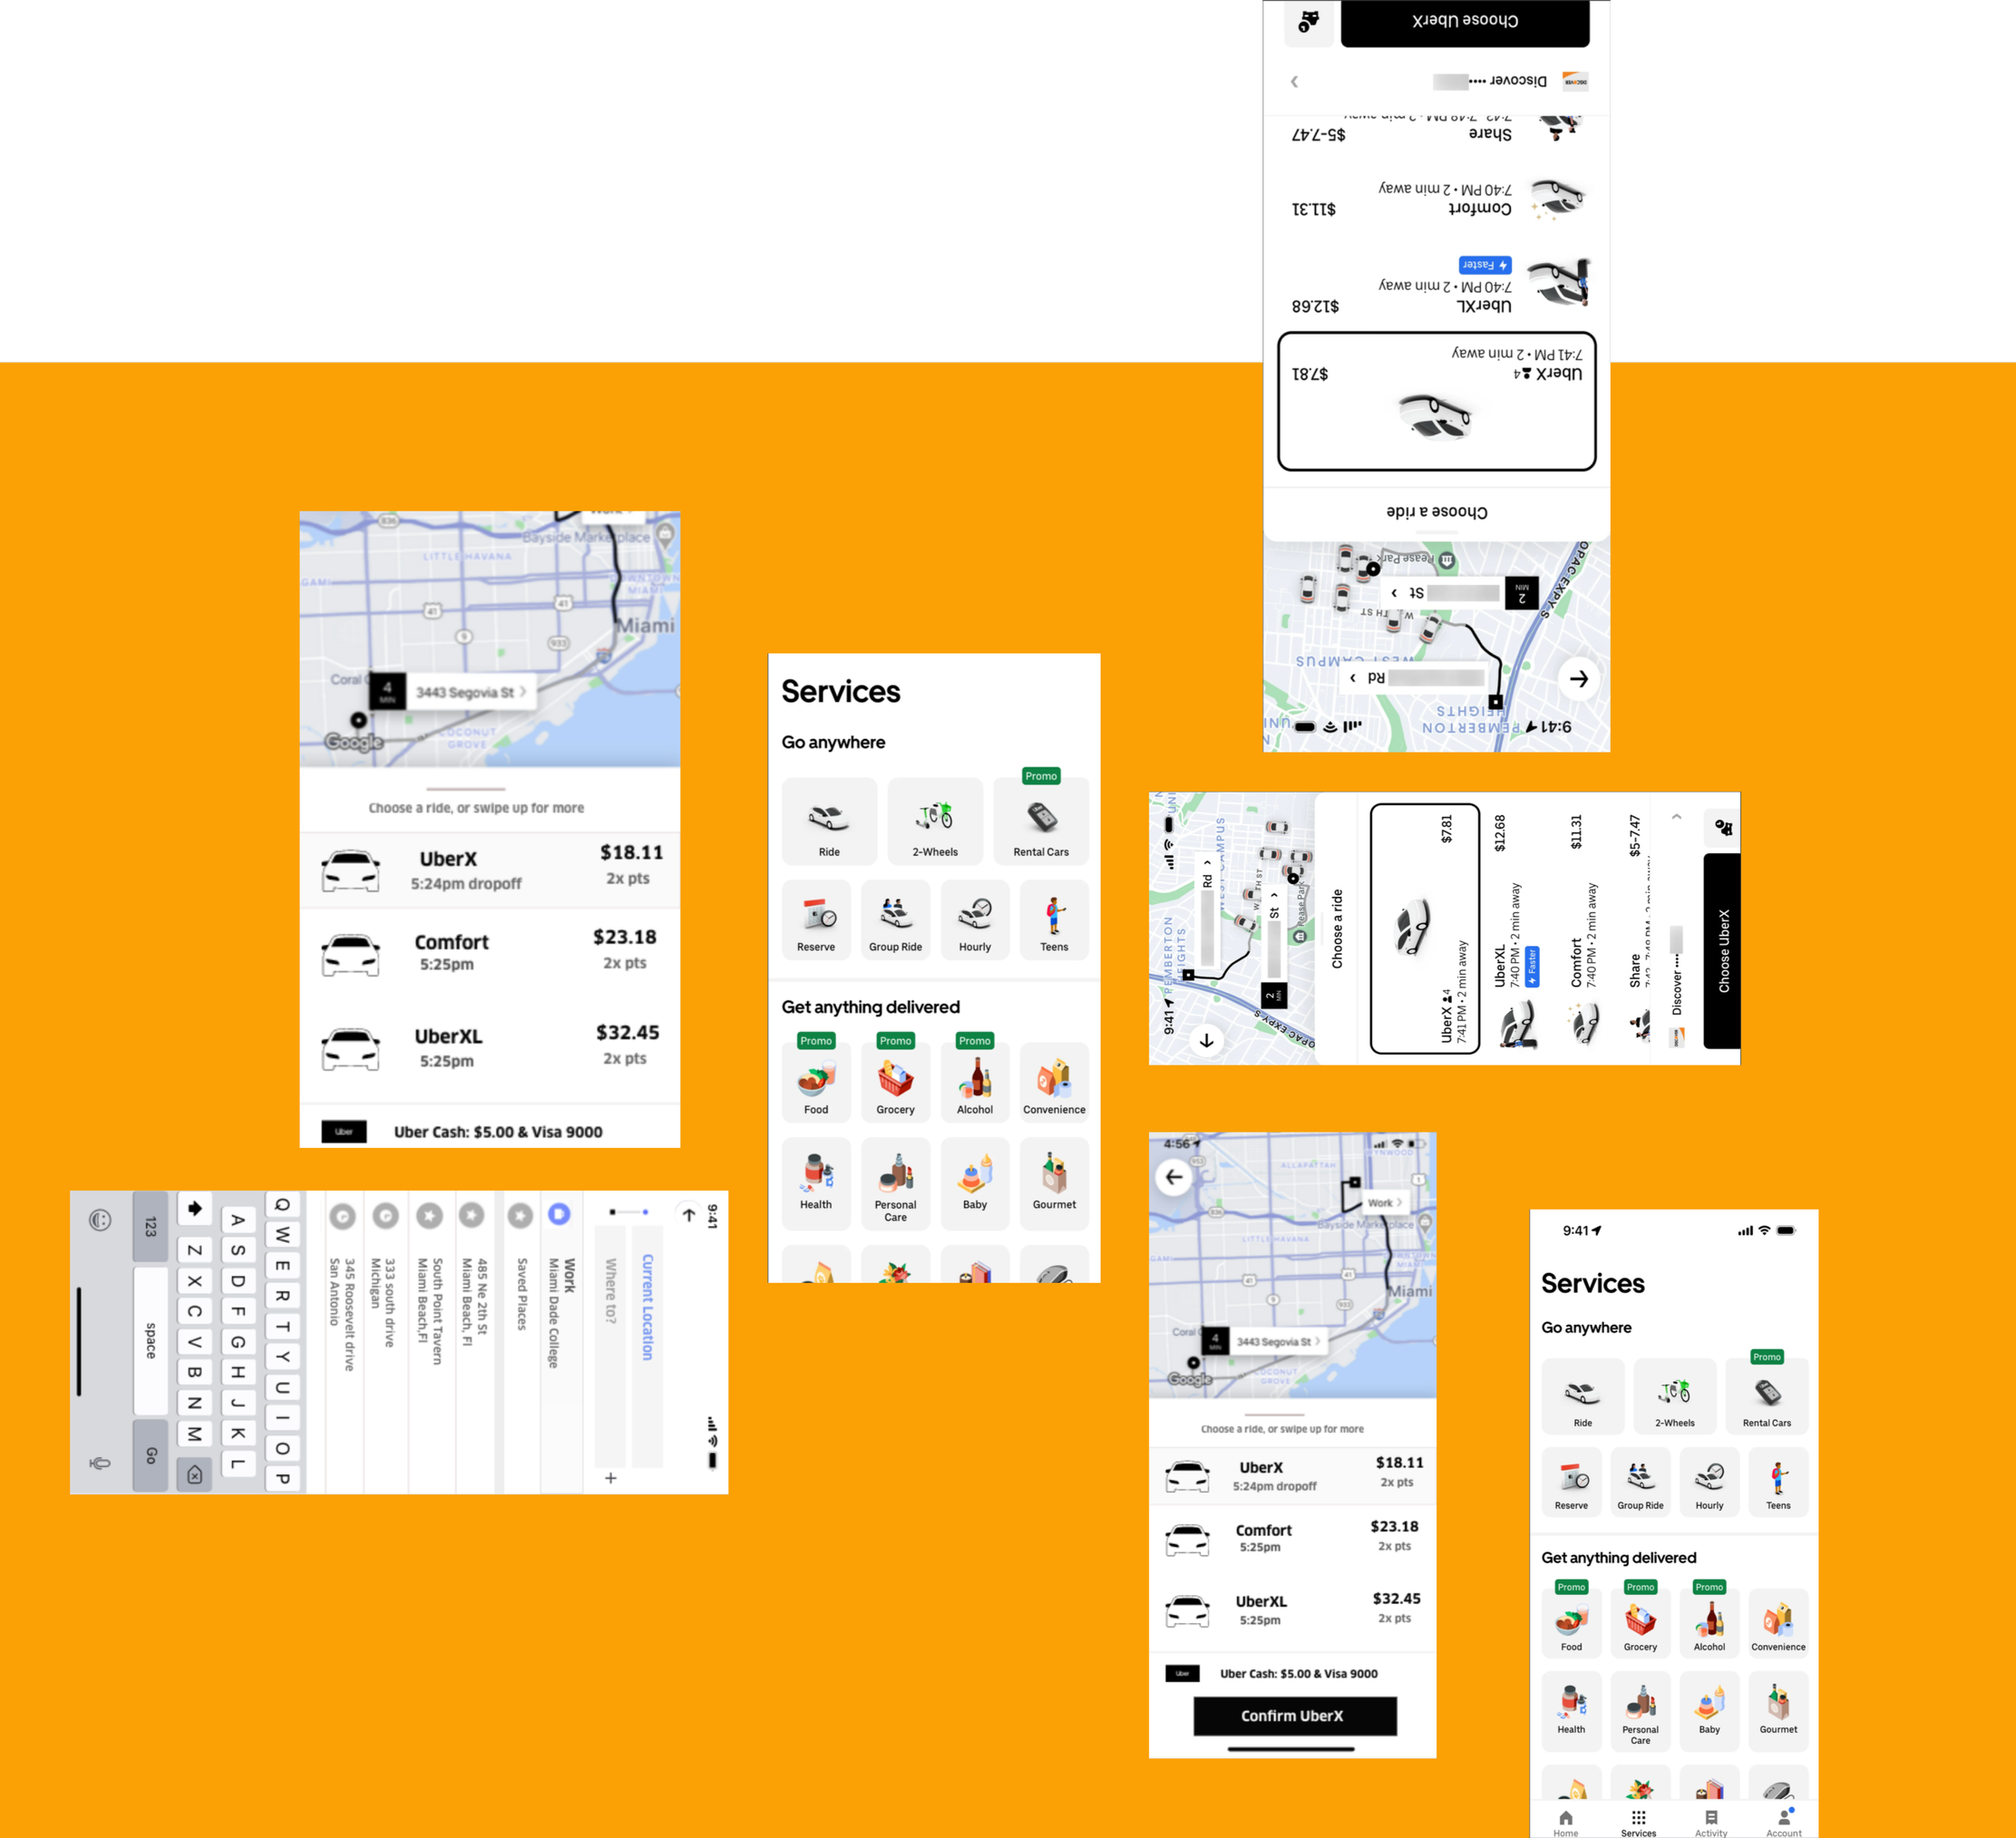
Design Ideation
Rationale
Participatory design and design sprints will be integral to our process. As we are learning about Uber’s internal design process, we plan on conducting sessions through trial and error to seamlessly incorporate our solution into the app.
As our research progressed, we noticed a consistent pattern: drivers were filling gaps in the system with informal workarounds. The underlying issue was a lack of real-time, actionable and trustworthy information during the moments that matter most. These unreliable guidance affects the drivers’ earnings, ratings and their overall trust in the platform.
This led us to our design question….
How might we design the Uber driver experience to surface real-time, trustworthy guidance during large-scale events, so drivers can make smarter decisions about matching, positioning, and navigation without relying on informal workarounds, while protecting their earnings, ratings, and trust in the platform?
Designing What Matters to Drivers
We have compiled 3 main themes in accordance to our findings. The listed can be found below.
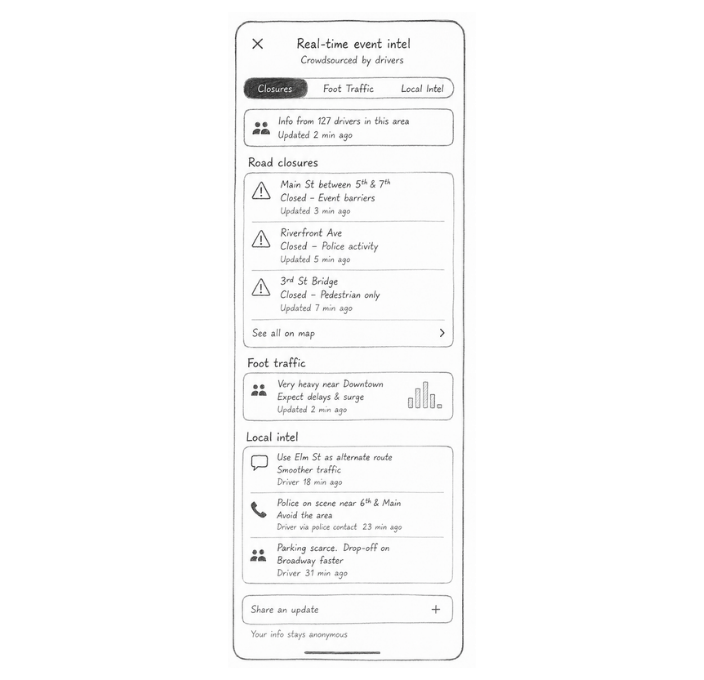
Ghost Frequencies
Uber's map data consistently lags behind reality during large events — drivers hit unmarked road closures, make repeated U-turns, and resort to asking passengers to walk. If we integrate a real-time road feed updated by drivers, police, and venue volunteers then drivers will spend less time hitting unmarked closures and rerouting. Currently, the only alert is physically encountering the barricade.
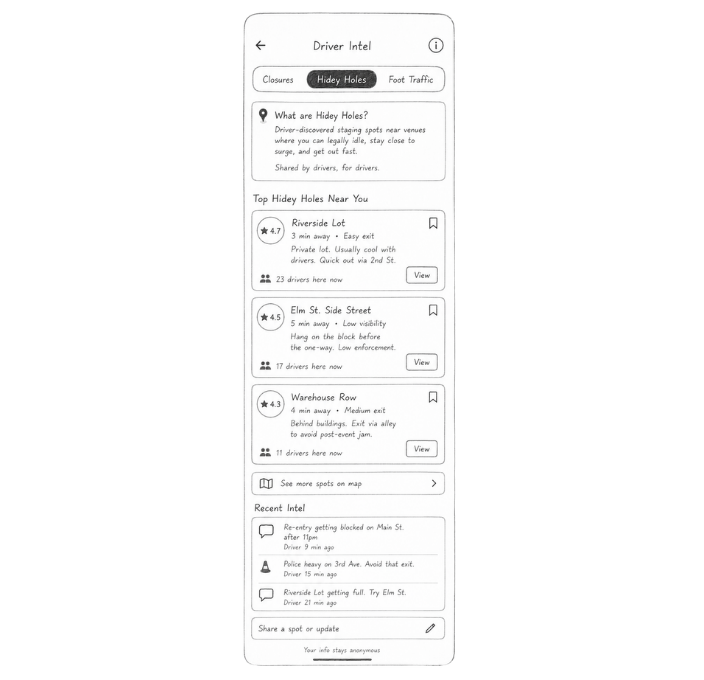
“Finding Your Own Fishing Spot”
Designated pickup zones technically exist, but they collapse under real event conditions, roads close, re-entry gets blocked, and drivers who tried them once don't return. Instead, experienced drivers develop their own "hidey holes": memorized staging spots near venues where they can legally idle, stay close enough to catch surge pricing, and exit quickly.
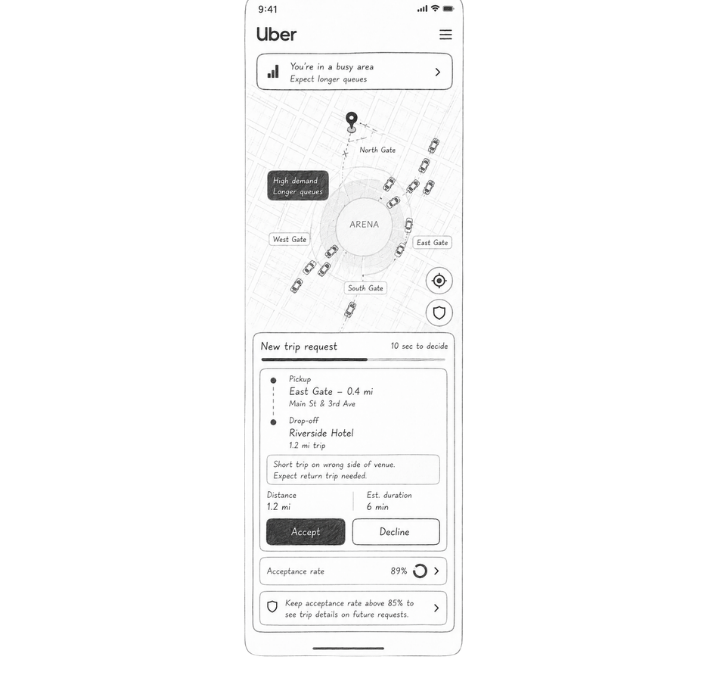
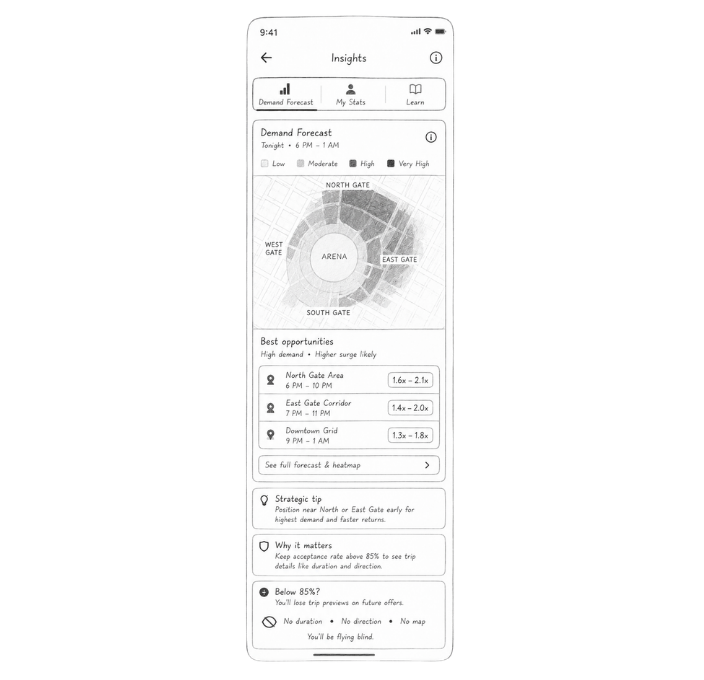
Street Smarts
During long queues, Uber often matches them with passengers on the wrong side of the venue for a short trip, and they get roughly 10 seconds to accept or decline. Declining protects their time but tanks their acceptance rate, and dropping below 85% strips away trip preview details like duration and direction, leaving them flying blind on every future offer. Providing pre-event demand forecast around venue areas positions drivers for better strategic choices on routes and surge participation.
Looking Forward

Next phase moves from understanding to design — using co-design with drivers across experience levels and markets to test and validate solutions.
Key validation priorities: cancellation rates at designated zones, driver deviation patterns, and surge timing curves from Uber's internal data.

The goal is a design framework that addresses the root — trustworthy, timely guidance that helps drivers earn fairly at large-scale events.